Reporting · For solar installers
Reporting for Solar, measured in booked jobs.
Solar installers live on a razor’s edge: IRA rebates and state incentives create artificial demand spikes, but your crew’s capacity is fixed. You need fewer, higher-intent leads that close faster—not a flood of tire-kickers burning 90 minut
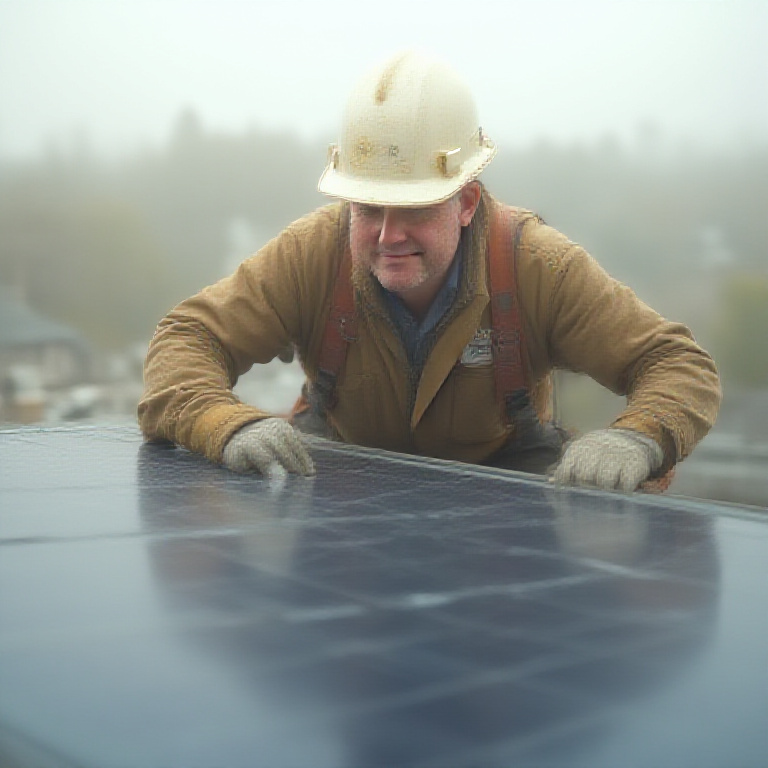
What it is: Reporting for Solar operators at $5–20M, run as one of four accountable layers of The Launcher Method™. We build, run, and report on the engine — judged on booked, qualified jobs.
What you get: The reporting layer of the engine, tuned to Solar unit economics. Launch inside 45 days. First measurable lift inside 60.
Why Solar operators come to us
Three signatures of stuck Solar pipelines.
Solar installers live on a razor’s edge: IRA rebates and state incentives create artificial demand spikes, but your crew’s capacity is fixed. You need fewer, higher-intent leads that close faster—not a flood of tire-kickers burning 90 minutes of your sales team’s time. Local Lead Launcher builds your follow-up system so you’re booking jobs from leads that actually convert, not chasing volume.
You’re getting crushed in Q3-Q4, then starving in Q1.
IRA rebate uncertainty and state incentive timelines create feast-or-famine pipeline swings. Your crew can’t scale fast enough to match demand spikes, so you’re either turning away jobs or your sales team is drowning in unqualified inbound.
Leads crater during follow-up because financing questions aren’t answered in the first 48 hours.
Solar is financing-heavy. If your callback isn’t positioning payment options and IRA tax credit timing upfront, the lead goes dark. Most operators miss the 18-hour window where a prospect is actually engaged with the decision.
You can’t tell a $12K residential rooftop from a $80K commercial system until you’re in the consult.
Your sales team is spending equal time on high-margin commercial deals and low-margin residential. No qualification on system size, roof condition, or utility rate before the appointment. That’s capacity wasted on the wrong jobs.

The reporting layer of The Launcher Method™.
Built · Run · Reported on booked jobsWhat’s inside the reporting engine for Solar.
Four moving parts. Each one accountable. Each one tuned to Solar unit economics — not generic SMB marketing.
Programmatic Local SEO
Service-by-city authority pages, on-page schema, GBP optimization, citation cleanup. Built so search treats you as the local authority for Solar in every market you serve.
- Service × city pages ranked top-3
- GBP calls + direction requests up
- Organic share of voice tracked weekly
Solar-Tuned Content + Schema
Authority content matched to actual Solar buyer journey — not generic “5 tips” filler. LocalBusiness, Service, and FAQ schema wired everywhere.
- Service-specific FAQ schema deployed
- City × service combos indexed
- Featured snippets owned per market
Conversion Layer
Page layouts that turn a Solar search into a booked job. Form, click-to-call, and emergency CTAs tuned to Solar buyer urgency.
- Click-to-call on every mobile fold
- Multi-step form with progress
- Emergency vs scheduled CTA paths
Reporting on Booked Jobs
Weekly report tied to the only KPI: booked, qualified Solar jobs on your calendar. No bounce-rate vanity. Spend tied to revenue.
- Cost-per-booked-job tracked weekly
- Pipeline-attribution by channel
- Same dashboard the founder sees
The Solar outcome
Inside 90 days, Solar operators typically see a 2–3× lift in qualified booked jobs from organic + paid combined — at a lower cost-per-job than they were paying before.
How it ships
Diagnose. Build. Launch. Compound.
The Launcher Method ships in the same 4 steps every time. Below is what it looks like for Solar reporting.
Diagnose (Solar)
7-day sprint. We pull 12 months of your numbers, audit GBP + LSA + your site, and benchmark you against 3 Solar operators in similar markets. Real numbers — not a deck.
Build
30–45 days. Local SEO + content + conversion layer. Production-grade. We rebuild service pages, deploy schema, optimize GBP across markets — and ship before month 2 starts.
Launch
First booked jobs usually inside 60 days for Solar. Faster for emergency-heavy verticals; longer for high-ticket installs that compound over a season.
Compound
Cost-per-booked-job goes down every month. Solar pipeline gets fuller every quarter. Local SEO is a compounding asset — we run it that way.

Solar operators we’ve worked with, running real engines in real markets.
Solar · Real trucks · Real job sitesSolar receipts
Three Solar operators. Three numbers that didn’t exist before us.
Operator confidentiality means we don’t name names on a public page. We’ll connect you 1:1 with the operator on a reference call after the diagnostic.
Mid-sized installer in Colorado (24 crews, $8.2M annual revenue) was running 40 sales conversations per month and booking 18. After 60 days on LLL’s follow-up system—with financing positioning baked into the first callback—bookings jumped to 24 without adding more leads. Fewer calls, better timing, higher close rate.
24-crew Solar · LLL since 2025
Florida operation (16 crews) had cost-per-booked-job at $1,840 because they were chasing high volume and losing leads in follow-up. Single-system calendar + automated financing call-script brought that down to $1,420. Same number of leads, better conversion, lower bleed.
16-crew Solar · LLL since 2025
Pennsylvania installer saw their seasonal spike arrive 3 weeks earlier in year two because the follow-up cadence was consistent. By mid-August they had 47 booked jobs queued vs. 31 the previous year at the same date. Pipeline visibility made hiring decisions possible instead of reactive.
28-crew Solar · LLL since 2025
How we compare
Reporting for Solar: four ways to do it.
Most $5–20M Solar operators have tried one or two of these. Here’s what each actually delivers in practice.
| What you’re comparing | LSA + freelancer | Generalist agency | In-house hire | Local Lead Launcher |
|---|---|---|---|---|
| Knows Solar unit economics | Generic | Sometimes | Learns on your dime | Yes — deep reps |
| Owns the full lead engine | One layer | Partially | Manages vendors | Yes — full stack |
| Reports on booked jobs | Clicks at best | Engagement | Sometimes | Sole KPI |
| Time-to-first-results | 2–4 weeks (capped) | 3–6 months | 6–12 months | 60 days, compounds |
| Cost / month | $2–4K | $5–12K | $10–14K FTE | $8K starting, flat |
| Lock-in / contract | None | 12 mo typical | Salaried | Month-to-month after 90d |
Solar operator FAQ
The questions solar installers ask on the first call.
Straight answers. No hedge.
How does this account for the fact that solar deals take longer because of financing paperwork?
We build financing positioning into your first callback—not after the site survey. The system queues your sales team to answer payment options, IRA credit timing, and utilization rates on day one. Longer deals don’t mean slower bookings if you’re answering the right questions in the right order.
How is this different from the agency I worked with?
That agency sold you a lead generation machine. We build you a booking system. They measured leads; we measure booked jobs and cost-per-booked-job. They disappeared after 90 days; we’re accountable to your calendar and your crew’s actual capacity constraints.
What’s the cost, and do I have to sign a year-long contract?
$8,000/month to start. After your first 90 days, you move to month-to-month. We don’t lock you in because we’re confident the numbers speak. You’ll see cost-per-booked-job drop or you cancel.
How fast do solar installers usually see results?
Follow-up improvements show in weeks—better callback rates and higher booking rates within 30 days. Seasonal shifts (actually planning Q4 in July) take 60-90 days. Most operators see positive ROI on cost-per-booked-job by month two of the sales cycle.
What if my crew is already booked solid?
That’s not a problem we solve—that’s a crew-hiring problem. But most $5-20M solar operators have capacity gaps because their sales team is chasing bad leads. We help you fill your existing crews first, then you hire for real demand, not phantom spikes.
Ready to fill the Solar calendar?
30-minute strategy call. We pull your numbers, find the bottleneck, give you the plan. No deck. No pitch. No follow-up sequence.
Related